
Diffuse Optical Tomography (DOT)
Gowerlabs specialises in High-Density Diffuse Optical Tomography (HD-DOT). Our LUMO system's dense network of sources and detectors generates thousands of overlapping data channels. This allows researchers to move beyond the typical channel-by-channel fNIRS analysis, and instead produce high-resolution, three-dimensional images of human brain function. Here, we describe the science behind DOT.
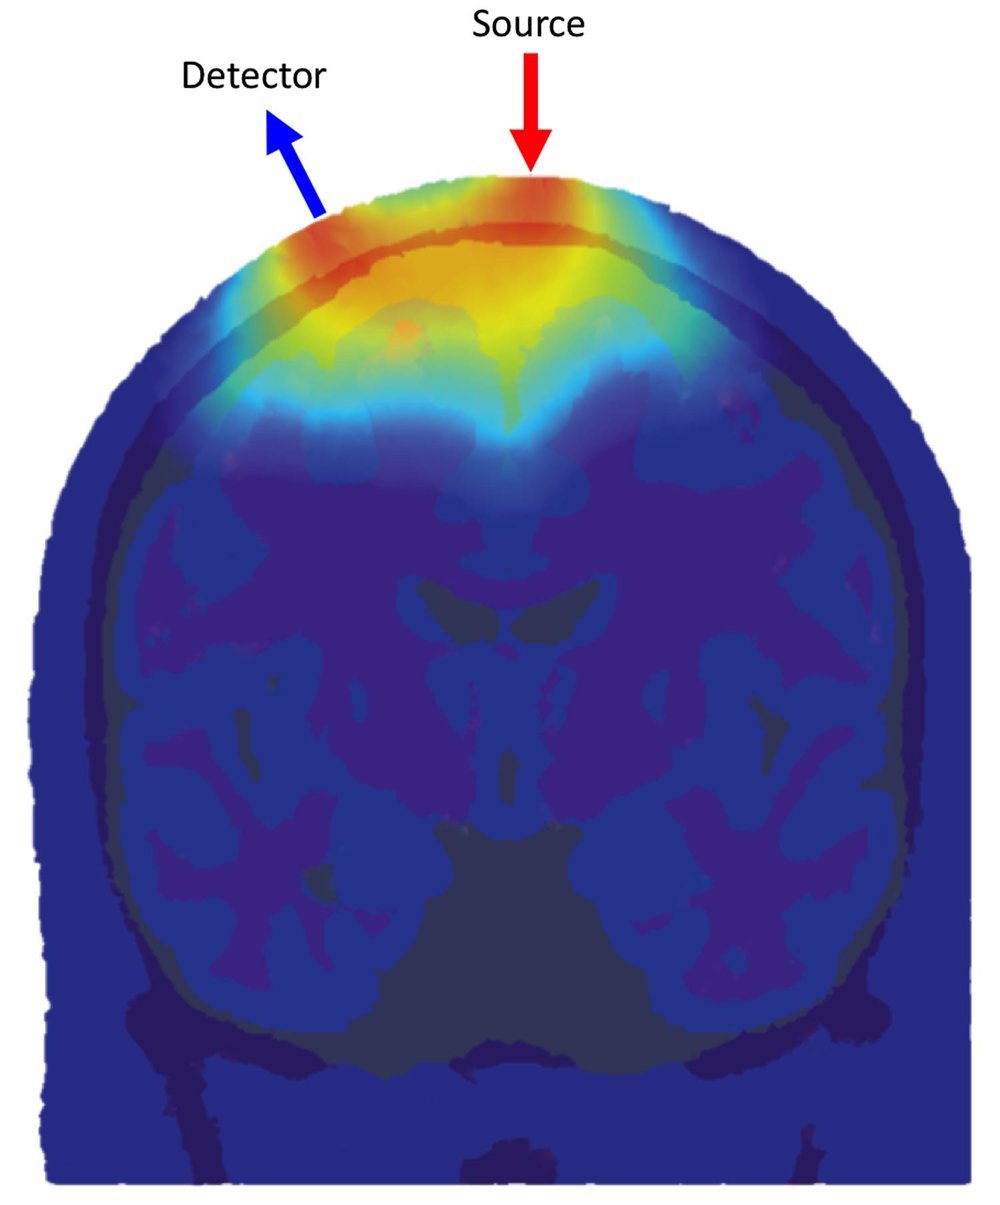
Figure 1
A Random Walk
When near-infrared light travels through tissue, it does not travel in a straight line. Instead, each photon moves in a random direction from one scattering event to the next. In this scenario, the light field is referred to as diffuse. If our goal is to produce images, the diffuse nature of the near-infrared light field presents a significant challenge, because the path taken by any given photon is impossible to predict.
Figure 1 demonstrates the distribution of detected photon flight paths through an anatomical head model for one source and one detector location. The greater the density of photon paths, the greater the sensitivity of the fNIRS channel to that location.
Figure 2
Greater than the Sum of its Parts
Despite their diffuse nature, fNIRS measurements contain significant spatial information. A given fNIRS measurement will only be sensitive to the volume of tissue beneath the source and detector, and the brain's haemodynamic response to increased neuronal activity is usually well localised to a specific region. Multi-channel fNIRS measurements are therefore highly suited for mapping human brain function.
Multi-channel fNIRS measurements require arrays of optical fibres, and the design of an array will dictate how much spatial information can be extracted from the resulting data. Traditional fNIRS experiments use arrays that contain only a single source-detector distance (usually 30 mm for adults), with the channels arranged in a grid-like pattern. While simple, these arrays provide no information about the depth at which a measured change in haemoglobin concentration has occurred.
However, by arranging the channels of an array so that their sensitivity profiles partially overlap, and by inputting all the measured data into a sophisticated image reconstruction algorithm, it is possible to produce 3D images of haemoglobin changes that contain significantly more spatial information than can be obtained by analysing all the channels individually.

Figure 3
Figure 4
Using Maths to Look Inside Your Head
The reconstruction of DOT images is what's known as an inverse problem: we must determine the distribution of haemoglobin changes in the brain that best explains the changes in optical intensity we observe at the scalp.
In practice, the solution to this inverse problem has three phases. First, it is necessary to construct an anatomically accurate computer representation of the head and brain of your subject. Second, we must establish a model of how the near-infrared light we detect has travelled through the tissues of the head from the optical fibre array: the paths taken by the detected light dictate the areas of the brain to which a given channel is sensitive and forms a solution to what is known as the forward problem. Finally, DOT images are reconstructed by inverting our solution to the forward problem and combining it with the measured data.
Figure 3 shows an overview of the DOT image reconstruction process. An anatomical head model is used to determine where the detected near-infrared light has travelled, and construct what is known as a forward model. By combining this with the measured data from the NTS Optical Imaging System, it is possible to create 3D images of brain function.
Figure 4 depicts diffuse optical tomography images of a somatomotor functional response in an adult. The 3D images of oxyhaemoglobin (HbO) and deoxyhaemoglobin (HbR) are displayed on the cortical surface.
The reconstruction of DOT images is the best way of exploiting the rich information contained within fNIRS measurements. At Gowerlabs, we are committed to developing and promoting DOT approaches, which are undoubtedly the future of optical neuroimaging.
Recommended Reading
Fogarty, M., Rafferty, S. M., Markow, Z. E., O'Sullivan, A. C., Svoboda, C. F., George, T., King, K., Wilhelm, D., Tripathy, K., Mugler, E. M., Naufel, S., Yin, A., Trobaugh, J., Eggebrecht, A. T., Richter, E., & Culver, J. P. (2025). Functional brain mapping using whole-head very high-density diffuse optical tomography. Imaging Neuroscience, 3, Article IMAG.a.54.